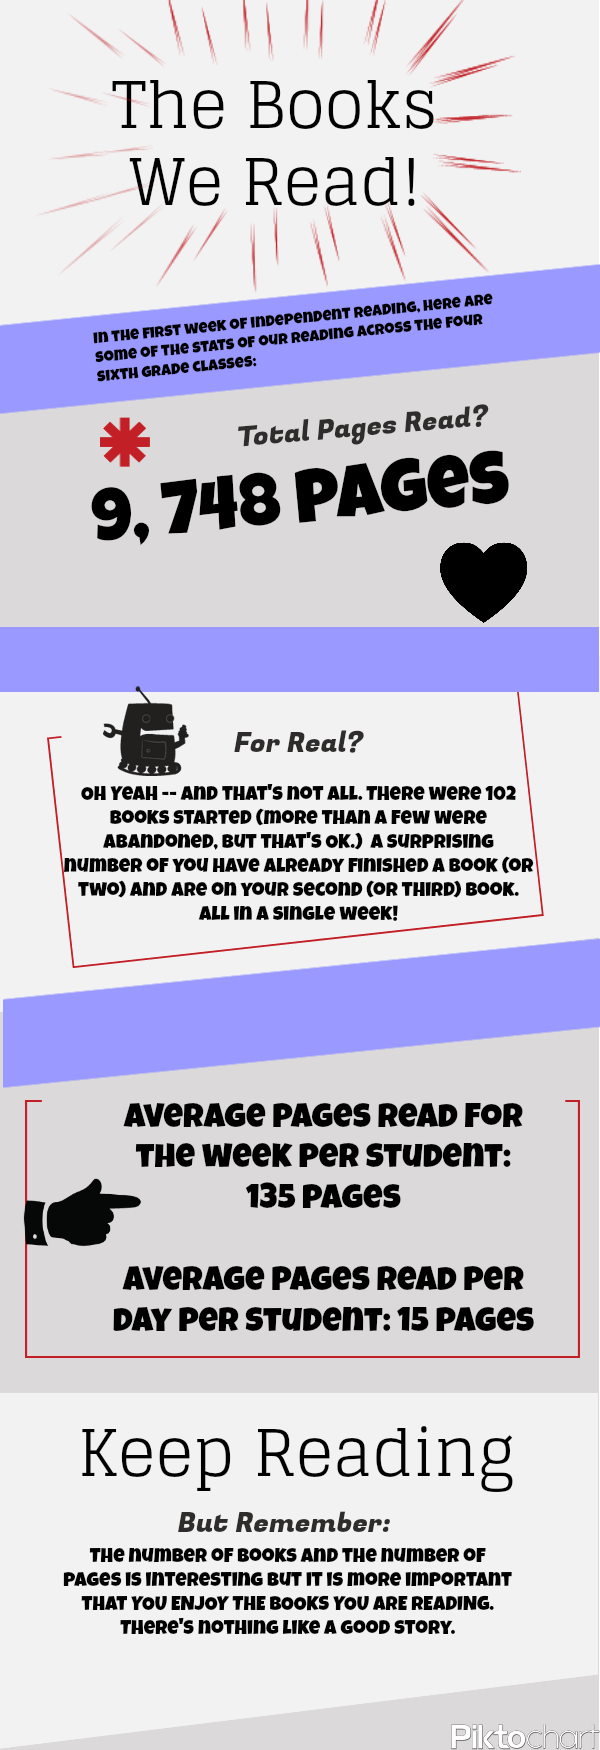
This infographic — the first one I have made — captures some of the data gathered from my four classes of sixth grade students. We were tallying how many pages they have read since the first week in January. It was interesting to have them guess, and talk about strategies for guessing, on the total number of pages they have read as a sixth grade. Some thought the number as low as 200 (really? with more than 70 students reading over eight days?) Others thought tens of thousands of pages (really? same facts as before). A fair number did guess 10,000 pages, which is pretty close to the mark.
As I was making the infographic, I realized that I could also do some averaging “per student” so I included that there. Obviously, some students read more than others in this independent reading unit. But I was interested to see how the numbers turned out, and will be interested to hear my students’ reactions, too.
Peace (in the books),
Kevin
Thanks for sharing. I’ve wanted to try infographics but have been intimidated. Any suggestions now that you’ve giving it a whirl?