Gooru: Another Research Project Resource

gooru
It’s been some time since I checked out Gooru, and boy, it sure has grown since. I went back to the site, which is a sort of filtered/collected search engine space, this morning because I know my National Writing Project friend, Paul Allison, is going to be talking about Gooru tonight on the Teachers Teaching Teachers webcast.

This is what Paul sent out, in case you can join him. (I am going to try …)

How do you teach with Gooru? We’ll be talking with teachers who use Gooru in their classrooms and want to connect and collaborate with other teachers. Hear from Gooru power users, share best practices, exchange ideas, and tell the Gooru team what we can do to improve Gooru for you.


Check out Gooru through the lens of this analysis of OER Project Blue Sky: Big Boost to OER From . . . Pearson?

We’ll be joined by @jackcwest @gooruteacher  Xenia Shiah: http://www.linkedin.com/in/xshih , Jody Donovan, @leahousdIT and YOU!
Join us at edtechtalk.com/ttt at 9PM ET/6PM PT/World Times: goo.gl/5Vr8M on Wednesday 1.16.13

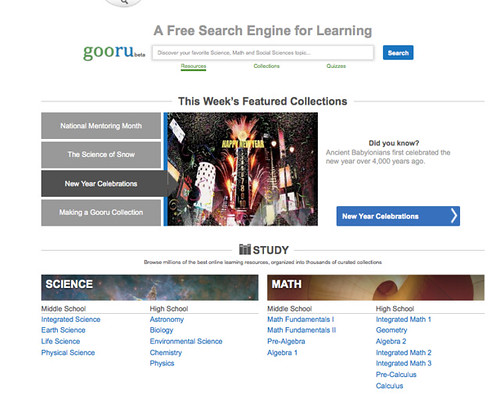
So, this morning, I went to Gooru to poke around a bit and remember what it is about. When I had been there last, the site had recently launched and I wasn’t quite sure what they were up to. There didn’t seem to be a lot of content. Now I understand. The site is another way to help students streamline their research queries (sort of like Instagrok, which I use) and for teachers to build up “collections” of resources that can be shared. I like the overall feel of the site — it takes a few minutes to get a sense of what to do, but once you understand it, you will see there are powerful paths to follow.

First, there is the basic search, which breaks down queries into categories, such as video, lesson plans, resources, etc. And along with peeking at the collections of other teachers, you can begin to create your own, too. (I started building one about Civil Rights, and then added in some collections of other teachers who had already been doing some of the same work, so that I did not have to do it all over again). There are places to add interactive quizzes, study areas for math and science and social studies (they note that ELA is on the way) and … more stuff that I had time to play with.

In the end, I think Gooru is another interesting research tool that can help students find information they need, in a meaningful way, and might allow teachers another opportunity to teach web-based search for projects. My history colleague is teaching Cuneiform writing right now, and so I did a search on the site for him, and what came up would be very valuable for his work with students, I think. Same thing for my science colleague, who is teaching volcanoes and has students doing some basic research right now. (In fact, we had a discussion at lunch about how so many of our students don’t have the basic search skills — even though I did a whole unit around it with them at the start of the year! Ah.)

Peace (in the share),
Kevin


Connect the Pop: Exploring Webcomics for the Classroom

Bitstrips for Schools1 Comics Creation & Critical Thinking: From Doctor Who to Bitstrips

Peter Gutierrez, over at Connect the Pop blog (part of the School Library Journal site), has been running an interesting series of posts in which he is interviewing the folks behind some of the more popular webcomic creation sites. Gutierrez, always thoughtful, is trying to explore how comic writing is different from traditional writing, and how webcomic platforms might allow entry into writing for some students through non-traditional transliterate ways.

He began with an interview with one of the founders of Bitstrips (and I use Bitstrips for Schools fairly regularly in my classroom). Bitstrip’s Shahan Panth explains where the idea for the site came from and how it connects to literacy.

I liked this observation from Shahan:

“Making a comic is not simple. You need to figure out the visual composition of each panel, the sequencing and pacing of your story, the body language and facial expression of each character in each shot. It’s a synthesis of so many different things, and for most kids, these are elements they haven’t had to think about before. Suddenly they find themselves in the role of comic auteur, responsible for considering and communicating every detail of a story.” — Shahan Panth, Bitstrips for Schools

Gutierrez also talked with my friend, Chris Wilson, of The Graphic Classroom (where I do reviews of graphic novels through a classroom lens), and Chris talked about the balance between students writing and reading traditional (paper-bound) comics and graphic stories, and digital platforms.

“Electronic comics creation is especially helpful for students who are not artistically inclined. In such a case, the differentiation of the online comic offers those students a chance to focus more on the story, characters, setting, plot and style more than the art. Online comics do not require expensive art supplies. Assuming the technology is readily available, students can create comics electronically as a way to demonstrate learning of any particular topic. Those can easily be shared on a teacher’s website. If technology standards are part of the objective, then online comics would be the way to go. I recommend varying the approach depending on the objective, class culture, student needs and resources.” Chris Wilson, The Graphic Classroom

The next interview was with Bill Zimmerman, whose Make Beliefs Comic site is a great way to introduce students to comic creation. The site is very simple to use, and has a translator built in for multiple languages. Bill also regularly posts a “rewriteable” comic that you can adapt right off his site, and then print out.

Bill notes that comics tap into the graphic culture that permeates the world of kids.

“All educators are desperately looking for ways to encourage youngsters to read and write and have discovered that comics, with their glorious drawings and the wonderful talk balloons that help move stories along, provide a vital resource to engage young people. We live in a very graphic society where children constantly see moving, comic images – sometimes on television and movies, sometimes on computer games. Kids feel very comfortable with these comic images and are hungry for more. ” — Bill Zimmerman, Make Beliefs Comics

MakeBeliefs Civil Rights 479x500 Comics Generators and Literacy: Edtech and Nontech Insights from Bill Zimmerman

I am really enjoying Peter’s exploration of comics, and look forward the next post.

Peace (in the frames),
Kevin


Two Views of Writing: Woody Allen and John McPhee

Check out this view of Woody Allen, old-school writer.


As I was watching it, I was reminded of an article I had just read in The New Yorker by John McPhee, who writes about how he writes in a piece called “Structure.” (I think it is part of the paid archive now, so may want to go to your local library — you still have one, right? — to check it out). McPhee brings us right into his whole planning and writing of longer non-fiction pieces, showing off visual structures of his content. You can see charts, and maps, and visual puzzles that form the backbone of his pieces. His larger message is try to move away from chronological sequencing, and instead, find new ways to structure content in a piece of writing. But that requires considerable thinking, planning … and an understanding of structure.

The connection to Woody Allen is McPhee’s memories of using large notecards and scissors and other tools to begin the planning, until he discovered the personal computer, and had another professor create some programs that replicated what he was doing with paper planning on the computer. So the second half of the article showcases what happens when ideas move from tangible notecards to a specific software text editor that can sort ideas, too.

I found it fascinating, in part because I often struggle with the idea of structure in larger pieces. I have never been able to find a good system for visualizing where I am going with a longer piece, and often resort to the old “this is the first thing …. this is the last thing” approach and McPhee’s illustrations were illuminating in many ways if only to remind me that there are many ways to write a piece, and perhaps digital tools — with their flexibility of replication and movement — might make some of that thinking easier. Or not. Maybe too many choices is just as difficult as too few.

Peace (in the text),
Kevin

Creating the Infographic: Nuts and Bolts


Yesterday, I shared out the infographic that I created using data from my students’ reading journals on how many pages they had read in the first week of our independent reading. It was really a way to capture the overall reading, excite them into thinking about data and books, and (for me) a way try out infographic creation. A few folks have asked how I went about doing it.

First, of course, I needed data. I had thought of using a massive chart in the room, having students track page each day. But that seemed cumbersome, and maybe a bit too distracting. So, instead, on the day I was collecting their reading journals for review, I had them write down the number of pages that they had read over the past week, or if they did not have access to every book they had read, they could “guestimate.” Those numbers ranged from 20 pages in a week to one student who read 1,000 pages in a week. (And I made no judgement on quality of books, either. It was all raw pages.)

Next, I used my calculator to come up with overall tally (almost 10,000 pages), and did some averaging: number of pages per student for the week and number of pages per student per day. Again, I was seeking interesting information that could be part of an informational display. I thought about adding the numbers of most and least pages read, but then realized that would make my slow readers feel bad about their fluency rates, so I abandoned that.

Now that I had my data, I needed a way to make the infographic. Of course, you can make an infographic in just about any platform. Powerpoint or Keynote work fine, and I realized later that Glogster would work well. But since I was exploring my own use of something new, I did some searching around. There plenty of tools now for creating infographics, although some are more “canned” than others. I went with Piktochart because it seemed flexible enough for my needs. And I found it easy to use. It was mostly Drag-drop, and replace text in their samples, and tinker with colors and design. A click of a button and I had downloaded it as an image file, and then uploaded it into Flickr, where I shared it here and at my classroom blog (which I will share again to the classes today).

Easy. (By the way, Piktochart has a handy resource on how to go about creating an infographic, including the thinking steps one should do.)

Peace (in the info),
Kevin


Books We Read Jan2013


My Son Turns the Camera on the Neighborhood

My eight-year-old son’s summer project was a documentary video about our neighborhood. My wife and I helped a little bit (holding the camera when he did the interviews and I helped with the editing). But all the ideas of what to shoot and where to shoot, and what to ask, were all generated from his curiosity about the place where he lives. His project has me wondering how to get my students to do more of this.

Peace (in the ‘hood),
Kevin


Creating an Infographic: The Books We Read

Books We Read Jan2013
This infographic — the first one I have made — captures some of the data gathered from my four classes of sixth grade students. We were tallying how many pages they have read since the first week in January. It was interesting to have them guess, and talk about strategies for guessing, on the total number of pages they have read as a sixth grade. Some thought the number as low as 200 (really? with more than 70 students reading over eight days?) Others thought tens of thousands of pages (really? same facts as before). A fair number did guess 10,000 pages, which is pretty close to the mark.

As I was making the infographic, I realized that I could also do some averaging “per student” so I included that there. Obviously, some students read more than others in this independent reading unit. But I was interested to see how the numbers turned out, and will be interested to hear my students’ reactions, too.

Peace (in the books),
Kevin

Book Review: The Fault in Our Stars

I know it’s not fair to compare the powerful The Fault in Our Stars by John Green to Wonder by R.J. Palacio and Out of My Mind by Sharon Draper, but how can I not? It’s not that the plots are similar. But the way that Green pulls the reader into the heart and mind of a character struggling with illness (or in the case of wonder, a birth deformity) follows a similar path, and I could not help comparing in my head the three novels and how it was affecting me — my heart. Green’s novel has been praised for its honesty of character, and I agree. Hazel, the narrator whose battling terminal cancer, is alive with voice in this book, and her truthfulness and toggling between seeing life for what it is and wishing it held out more for her and the people around her is touching.

Still, I felt a bit of a detachment from Hazel, and from her friend, Augustus, whose life force holds the story together. I’m not sure why I felt this detachment because I did care about Hazel and I did admire the way that Augustus believed in living to the fullest, and was touched by the love that he had for Hazel. But unlike the main character in Wonder, where I wanted to reach out and hug and protect  August (almost the same character name — odd, right?) because his inner voice was so authentic, and so powerful  — and in Out of My Mind where you just want to scream out to the world on behalf of the forced-silent Melody — here, I didn’t quite feel that emotion.

Green is clearly a gifted writer (this is the first book of his that I have read) but I felt as if I was being manipulated as a reader through the use of cancer as the plot device. Maybe this is because my own family has been touched by cancer, and its impacts, and I needed that detachment as a reader. I’m not discounting that. I’m happy that I read The Fault in Our Stars and I understand the high praise it has garnered (and might garner more in the coming weeks). For me, though, I found it missing something I can’t quite describe.

Peace (in the book),
Kevin


The State of Webcomics and The Economist

There was an interesting article the other week in The Economist magazine (which we get at our home through some free subscription that some kid was selling as a fundraiser) that talked about the growth of Webcomics. It was pretty fascinating, as it showed another example of how the flexibility and individuality of the web as a publishing platform is chipping away, quickly, at newspapers and magazines (irony that I read it in a magazine but can share it online? yeah).

The article – entitled “Triumph of the Nerds” — notes that as the comic sections in many newspapers have remained predictable and stale, the quality of webcomics has pushed new limits. In my view, sometimes those webcomics work; sometimes, they don’t. What the article points out is how successful webcomic artists are using social media to nurture an audience, without the restraints of a publisher breathing down their neck, and to try new ideas, new approaches that might not otherwise work in a traditional format.

The article gives a nice historical overview of comics, too.

“Cartoons go way back before newspapers. They have their origins in the caricatures and illustrations of early modern Europe. In Renaissance Germany and Italy, woodcuts and mezzotint prints were used to add pictures to books. By the 18th century simple cartoons, or caricatures, circulated in London coffee shops, lampooning royalty, society and politicians. Popular engravers such as William Hogarth and James Gillray came up with tricks we now take for granted: speech bubbles to show dialogue and sequential panels to show time passing.” — Triumph of the Nerds, The Economist

And it reminds us of the present circumstances.

“The decline of newspapers and the rise of the internet have broken that system. Newspapers no longer have the money to pay big bucks to cartoonists, and the web means anybody can get published. Cartoonists who want to make their name no longer send sketches to syndicates or approach newspapers: they simply set up websites and spread the word on Twitter and Facebook. ” — Triumph of the Nerds, The Economist

And there is the warning note, too. Making a living as a webcomic artist is difficult and making a living off it … fraught with unknowns.

“This new world, in which humour spreads instantly and globally, threatens webcomic artists at the same time as it liberates them. Cartoons can spread around the web without crediting their creators; copyright thieves can sell unlicensed merchandise. Cartoonists need to be entrepreneurs, as well as artists. Online cartoons can be lucrative, but unlike working for a syndicate, they hardly provide stable work.” — Triumph of the Nerds

Peace (in the comics),
Kevin


Digital Writing: Jogging the Web with Anna

Jogweb Conversation Site
Anna Smith and I have been working on a digital dialogue about digital writing, and some friends and readers have asked for us to provide a more coherent “path” to those conversations. That makes sense. You should know our intention is to eventually create a larger curated resource at the National Writing Project Digital Is site, but for now — in the midst of our give and take — it is all just a series of blog posts at Digital Is. I created this Jog the Web as a way to create a sequential “path” so far, so if you are just jumping in to the discussions, you can track where we have been.

Jump to the Jog the Web project

As always, we invite you to join the conversations over at Digital Is.

Peace (in the sharing),
Kevin