One of the suggestions for the last cycling of the Making Learning Connected MOOC is to create an infographic of some element of the experience in the online learning community. I blog. A lot. So I spent some time, going back in time on my blog, looking at what it was that I was writing about. The numbers tell the story. I began blogging early, as I am one of the facilitators, and I kept blogging often, once the MOOC got up and running.
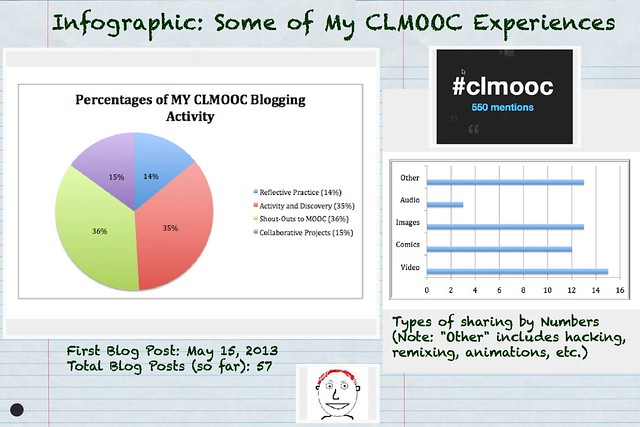
The breakdown of themes of post is something I find interesting, as I had a fair balance of cheerleading for the MOOC in my role as facilitator and sharing out activities as a member of the MOOC in my role of maker/creator. I can’t help but notice the lower percentage of reflective posts, but I suppose that is given when you are in the midst of an event like the CLMOOC. (This post should give it a little bump, right?) Even I was a struck by the number of blog posts I have published (57) and I do wonder if I would have served the MOOC better just to be quiet a bit more.
Looking at the chart of types of projects, it is clear that I did a lot of work around video, and I suppose that is true. Whether Vine or stopmotion or documentating the world, I turned the lens of the camera on the make activities. Perhaps it is the visual element and ease of sharing that attracts me to video. I’m not sure. There’s also the “wow” factor when it comes to video.
The top right is a chart pulled from Vizify, and I had wondered if I might be able to find out how many #clmooc-tagged tweets I had done. 550? That’s a lot of tweeting. I can’t confirm that number, though, but I don’t dispute it, either. Again, my impulse is to wonder why I didn’t just be quiet and it spurs a fear that my voice dominated too much. I hope others felt like they had space to write and share. (I wrote about this in Google Plus, too, a few weeks ago).
Speaking of Google Plus, I have no idea how many posts and conversations I was part of. I can’t figure out a way to track that, which is odd, given the Google Analytics tool. Let’s just say … a lot. On Flickr, I posted 30 photos (including some tutorial comics that we used at the CLMOOC website). On Youtube, I posted 10 videos (I think).
In other spaces …. no idea.
And let’s face it — being part of the MOOC was beyond numbers and data. It was about connections, and if I could quantify the value of that sense of community and the strengthening of ties across networks, it would blow away all of these numbers. In the end, that kind of “soft data” and personal connections is what the MOOC was all about anyway.
Peace (in the crunch),
Kevin
It’s useful to count occasionally to check what your instinct tells you, not obsessively and with time enough in between checks to see patterns. I’m glad you added that beyond “numbers and data” because counting and metrics can take over the process, which, ultimately, is not about them. They are just tools. No hit or SEO left behind…
Last November I double entered NaNoWriMo and DigiWriMo…useful and informative but won’t do that again. By creating a frame to fold daily writing into both, I learned a lot about my patterns and my daily output.
Gordon Lockhart, a mooc-met retired Scots physics lecturer who codes for fun, created the script for a blog comment scraper, WordPress and Blogger. You can also search your self on G+
Sometimes I remember to copy and save longer comments but that’s another nuisance ~ like word counting.
Thanks for those links, and for the insights. It’s beyond numbers, of course.
Kevin