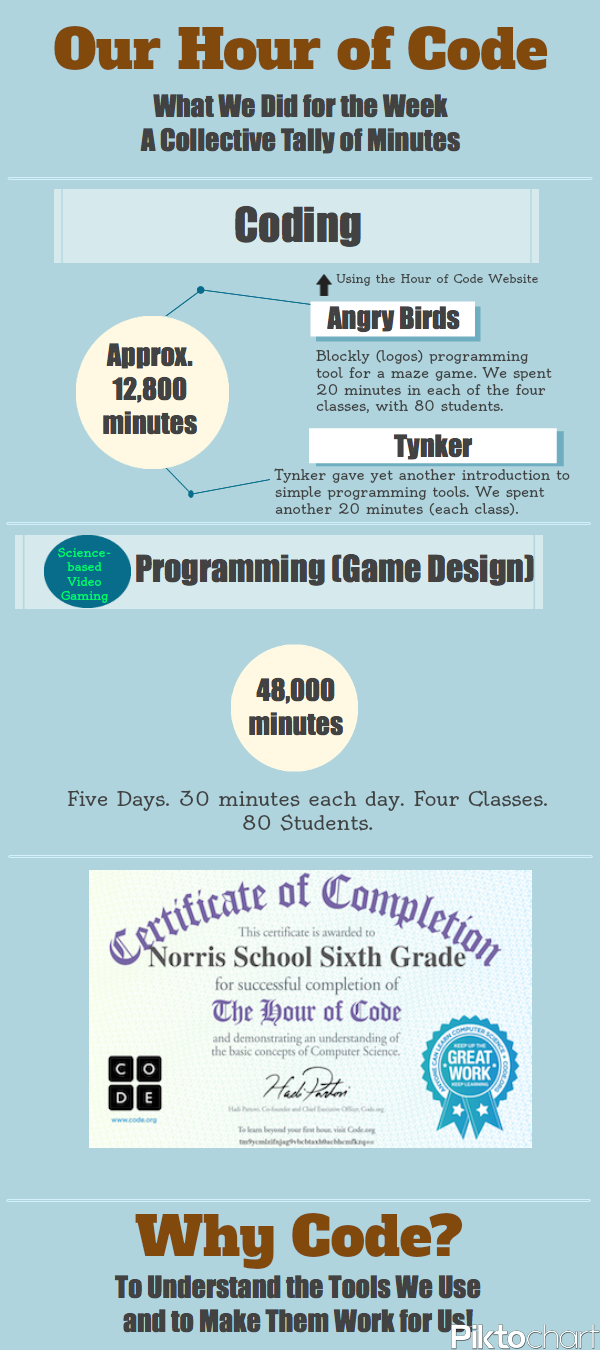
I tried to keep track during the week of the minutes that my sixth graders did with the Hour of Code project. Between teaching and playing with simple coding programs and sites, we also spent a good amount of time around programming with our science-based video game design project now underway.
I used Piktochart to make this Hour of Code infographic, although I have to say outright that the total minutes are collective (all students time on tasks together) and in the end, the numbers are interesting but meaningless. The real success is that I can see we sparked interest in computers and technology this week in ways that I had not been able to before, AND lots of girls as well as boys were deep into the activities.
Peace (in the numbers),
Kevin
Love this infographic creator. Did you create this with your kids? Would love to know more about it. So much info in this one graphic. Wondering how many decisions you make as you create it. Will go explore! Thanks for sharing!