We took our students on a field trip to the Boston Museum of Science yesterday (long day!), which is a wonderful space of interactive displays and special exhibits (The Grossology Exhibit, in particular, was a huge hit with a certain kind of kid).
I was particularly interested in a special exhibit around math that had all sorts of interactive engineering technology activities (design a skyscraper, build a song, determine probability of a huge flipping coin, etc.) and something known as the Hall of Human Life.
In the hall, you had the option of collecting a wristband, and as you did a series of activities, it showed you your data in relation to 200 other museum visitors. There were activities around nutrition, calories burned with each step, how light affects your sleep and depth perception, focus and attention, flu symptoms, balance and more. I suspect that many of these “activities” are really research projects for some grad students in the Boston area. The results shown are often broken down into categories, such as age and sex and other factors (which you put into the computer when you pick up your wristband).
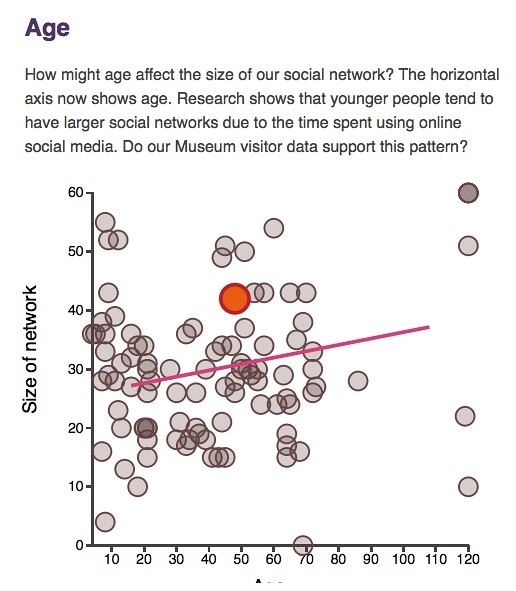
What is cool is that you can come home, and check out your data from the online site, too (anonymous, as we are only a wristband number – no name was ever asked), and the chart above shows one of the data pools from a set of questions around social networks. I found it intriguing that the museum found a way to engage us in a series of interesting activities, probably as a anonymous research subjects, and the spit the data out for us to examine as part of a larger collection.
We had a blast at the Museum of Science, and this was just one small piece of the day that stuck with me as I looked at my own data this morning via the website portal (I am the red dot).
Peace (in science),
Kevin