Here is something cool I stumbled on in my RSS — 40 Useful and Creative Infographics — which shares out some amazingly complex information in very visual terms.
I like this one:
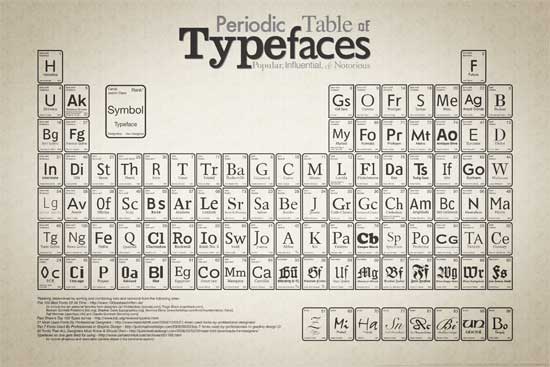
Periodic Table of Typefaces
But there were many others (including the History of Beer and the financial crisis mess and deaths in Iraq and more).
Peace (on the page),
Kevin
